
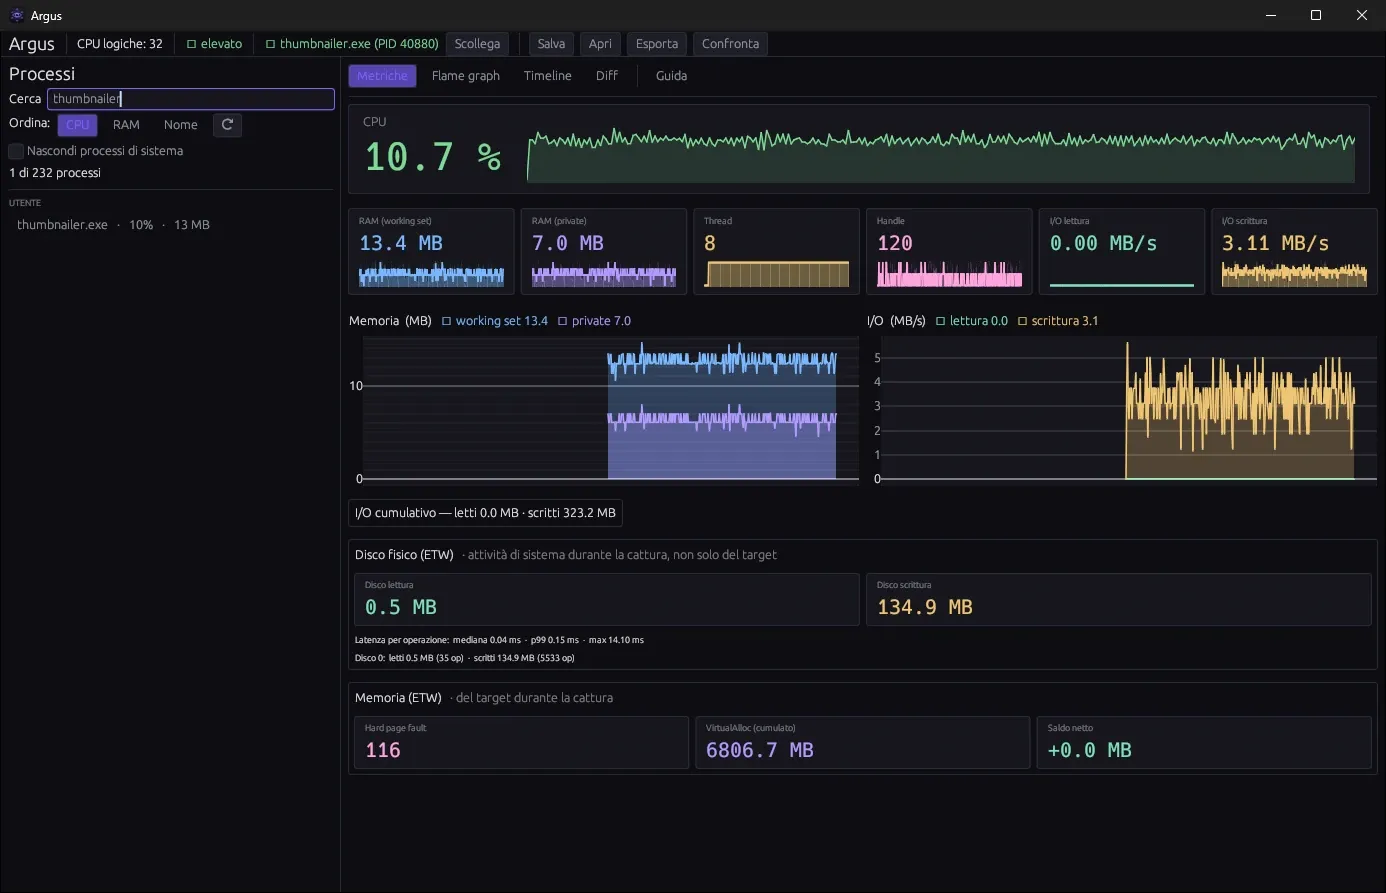
Live metrics
CPU, working set and private memory, I/O, threads and handles, each with a graph and an explanation.
Profiling tools show plenty of numbers but don't explain what they mean, and finding out why a program was slow took time and several tools.
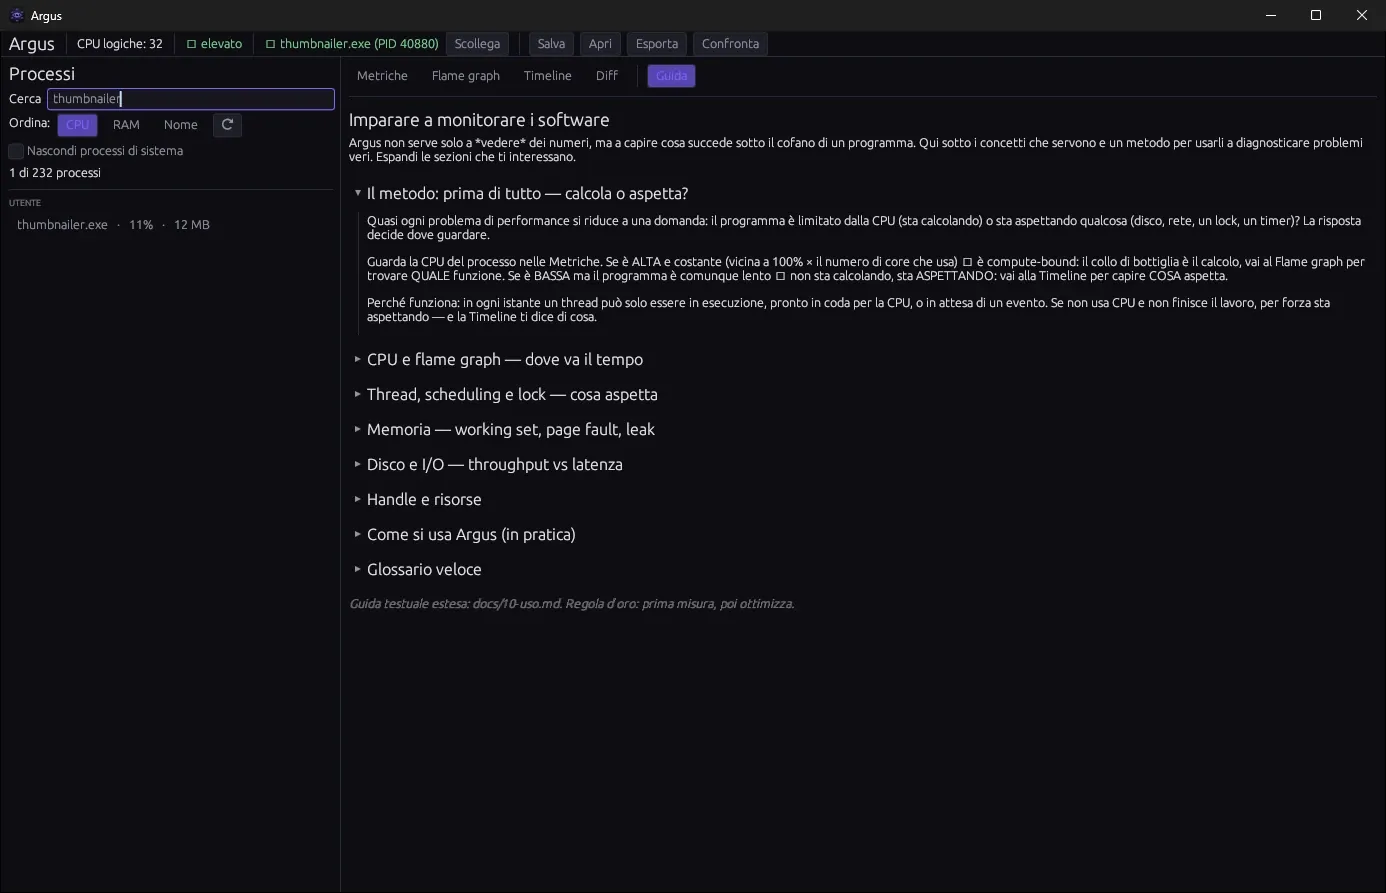
It attaches to a program that is already running and shows its CPU, memory, I/O, threads and locks, with an explanation for every metric and a guide to finding the bottleneck.
01 — Overview
Argus attaches to a program that is already running, without modifying it, and shows how it uses CPU, memory, I/O, threads and locks. Every metric has a short explanation of what it measures and what an unusual value means.
CPU, working set and private memory, I/O, threads and handles, each with a graph and an explanation.
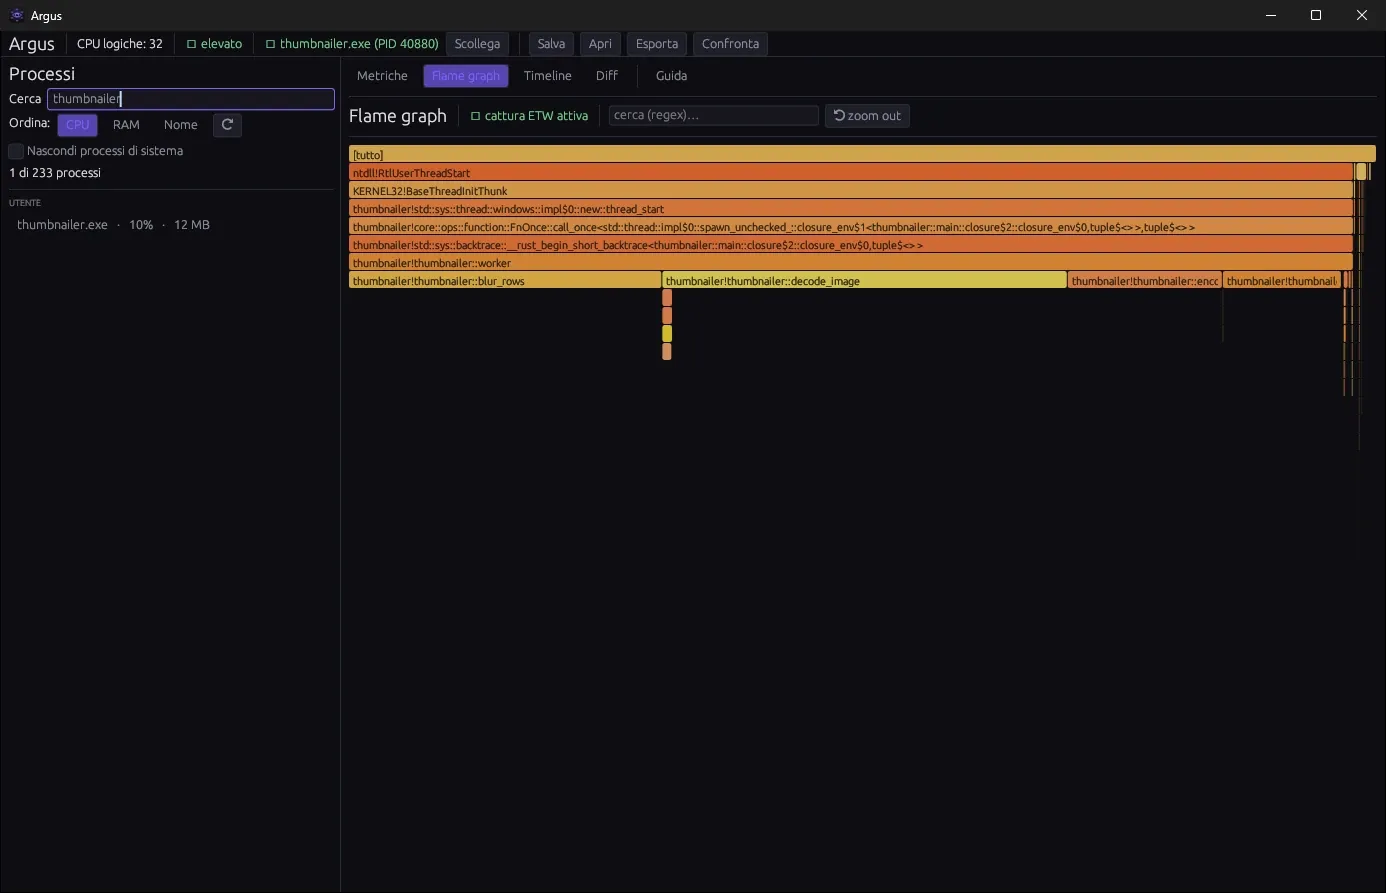
Where the process spends CPU time, from ETW samples, with zoom and search.
Thread states over time and what each thread is waiting for: locks, I/O or nothing.
Hard page faults and allocations; disk operations with median and p99 latency.
Recordings saved as .argus files, to replay later or to compare before and after a change.
Data to CSV, the flame graph to SVG, the whole session to JSON.
02 — Details
Windows 10 or 11, 64-bit. Argus is a single portable .exe; the zip also contains a script that installs it for the current user.
Flame graph, timeline, disk and memory use ETW and need Argus to run as administrator; the basic metrics work without.
Projects
 Orbit
 Pulse
 Prism
 Cove
 Inlay